Debug django project with embedded python debugger pdb
I use sublime-text as code editor. It doesn’t have a debugger, so to debug django projects i often used
print var_name
and look for output in local development server console. I use this approach today also, but sometimes it is great to run code step by step to see variables at each step.
It can be done with embedded python debugger pdb:
import pdb; pdb.set_trace()
I.e. we put this line in needed place of code, where we want so stop. It is a breakpoint. Now refresh project page in browser. When project code will reach this line, browser will hang and in console we’ll see:
(Pdb)
We now inside debugger and can input commands, for example these:
- l - (list), look the source code
- n - (step next) step to next line without entering inside function
- s - (step in) step inside to next line, i.e. if we are standing at function call, we’ll go inside this function
- r - (step out) step to first line after current block of code. For example, if current line is inside cycle and
ris pressed, next line will be first line after this cycle. - c - (continue) continue until next breakpoint, i.e. until
pdb.set_trace() - p - (print) execude python code or just show variable:
p var_name
Example
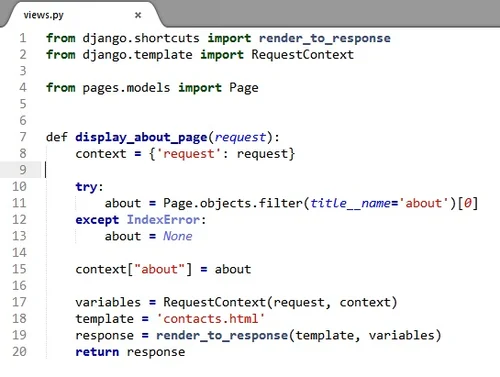
Suppose we have such a view:

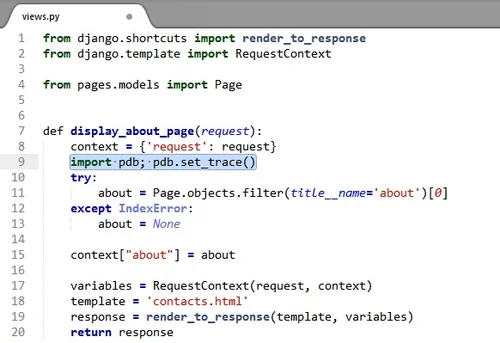
Insert import pdb; pdb.set_trace() in needed place and run dev server, if it not already started:

In browser access the page, that calls this view. The page will hang:

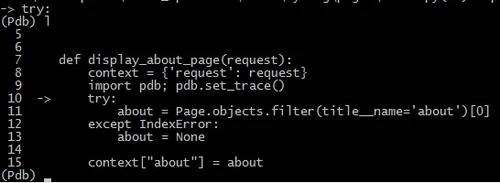
In console we see (Pdb):

Lets look, where we now by command l:

Make two next steps with n:

Look value of variables about and about.content:

Continue with c:

Page is shown in browser:
